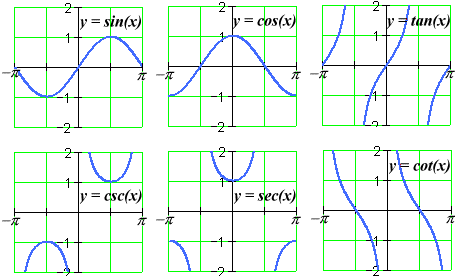


In this picture in demonstrates both sine and cosine. Sine starts at 0 and ends in 0 because at 0 degrees in the point (1,0) sine is 0. In the other hand cosine is 1 in this point and why it starts and ends at one.
This picture is csc and it relates to sine because the reciprocal of csc is 1/sin. When we graph the sin (which is the red) we see that in order for their to be an asymptote sin has to equal 0 and in the graph that happens at 0 degrees, pi, and 2pi. From that highest point we can now draw are graph, which they reach close by the asymptotes but it doesn't touch it.
 This picture shows sec and it relates to cosine because the reciprocal of sec is 1/cos. We can see the cosine in pencil and we know that for there to be an asymptote that cosine has to be 0 and why the asymptotes are at pi/2 and 3pi/2. From there we can draw our graphs.

The picture shows tangent and it realtes to both cosine and sine because tangent is the same as sin/cos and when cosine is0 then there will be as asymptote. Cosine is 0 at pi/2 and 3pi/2. We need to lead the graph towards the asymptote and why tangent (green) looks that way.
If we also notice all of the graphs are in the upper graph because all of them are positive in the first quadrant (0 degrees-90 degrees). This pattern is shown in this graph with the All Students Take Calculus.
http://www.wmueller.com/precalculus/newfunc/invtrig.html

No comments:
Post a Comment